A year two project by group 136. We will look into the basic concepts of how wireless communication (3G in particular) is transmitted securely and discretely by using methods such as modulation with pseudo code to transform the signal basically into 'random' noise.
Wednesday, 27 February 2013
Testing with multiple users
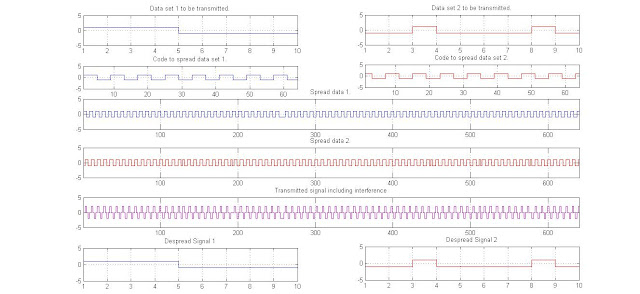
Here we have the results of using 2 separate users with different spreading codes and data. The blue coloured plot represents the components for User 1 and the red coloured plots represent the components for User 2. The combined spread signal or 'interference pattern' is purple. The basic method of receiving the original data from the interference pattern is to multiply the pattern with the original spreading code, and then divide the signal by however many users are in the interference signal.
Subscribe to:
Post Comments (Atom)

No comments:
Post a Comment